Warehousing and Logistics: Reducing Lead Times and Improving Customer Service
Project:
In a multinational company working in the fashion industry, we had the opportunity to collaborate on the construction of various analysis tools useful to the logistics division.
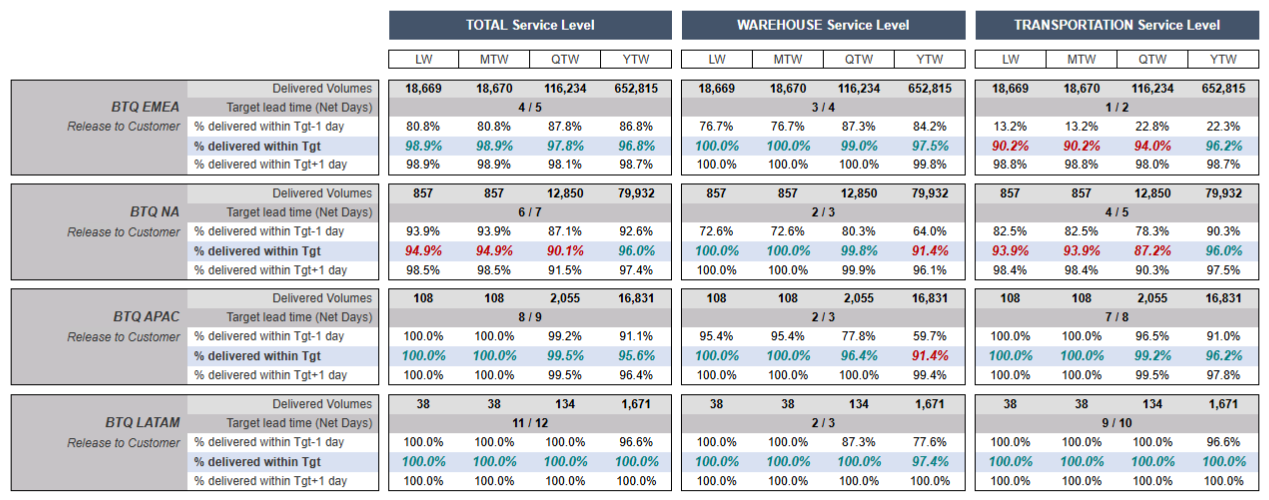
The need was to study how long it takes the goods to go through the various stages from the creation of the sales order to the preparation of the delivery and from the loading onto the truck to the delivery to the final customer.
These times are initially worked out to apply ‘net neutralities’, such as holidays, and then compared with specific targets for individual stages so that a satisfaction percentage can be calculated to be used as a service level indicator.


Particularly effective was the ability to standardise data during processing, either because it came from different sources in the case of mergers or acquisitions, or because of the natural differences in organisation within different warehouses located in different geographical areas.
The tools used to create specific databases for these purposes were SAP Data Services and SAP BW4Hana, while both QlikView and SAP Business Objects Business Intelligence were used for their presentation.
Results:
This project made it possible to split the different steps of the process between the various entities responsible for them, both between the several warehouses around the world and between the departments within them, and between the couriers working as suppliers. This allowed us to identify ‘grey areas’ and take action to improve and optimise the timing of internal logistics and distribution to the final customer.


Do you want to know about our experiences?
Delve into our areas of success and be inspired by our stories of innovation.
