Data Analysis in the Insurance Sector: Strategies for a Data-Driven Future
Project
An insurance company specialised in agricultural risks involved us in building a Business Intelligence environment based on Qlik Sense. We analysed data of the Omnia Insurance management system, integrating also the historical data of previous software.
The first requirement we chose to address was the analysis of portfolio data and related claims, both for existing contracts and those from previous years’ campaigns.
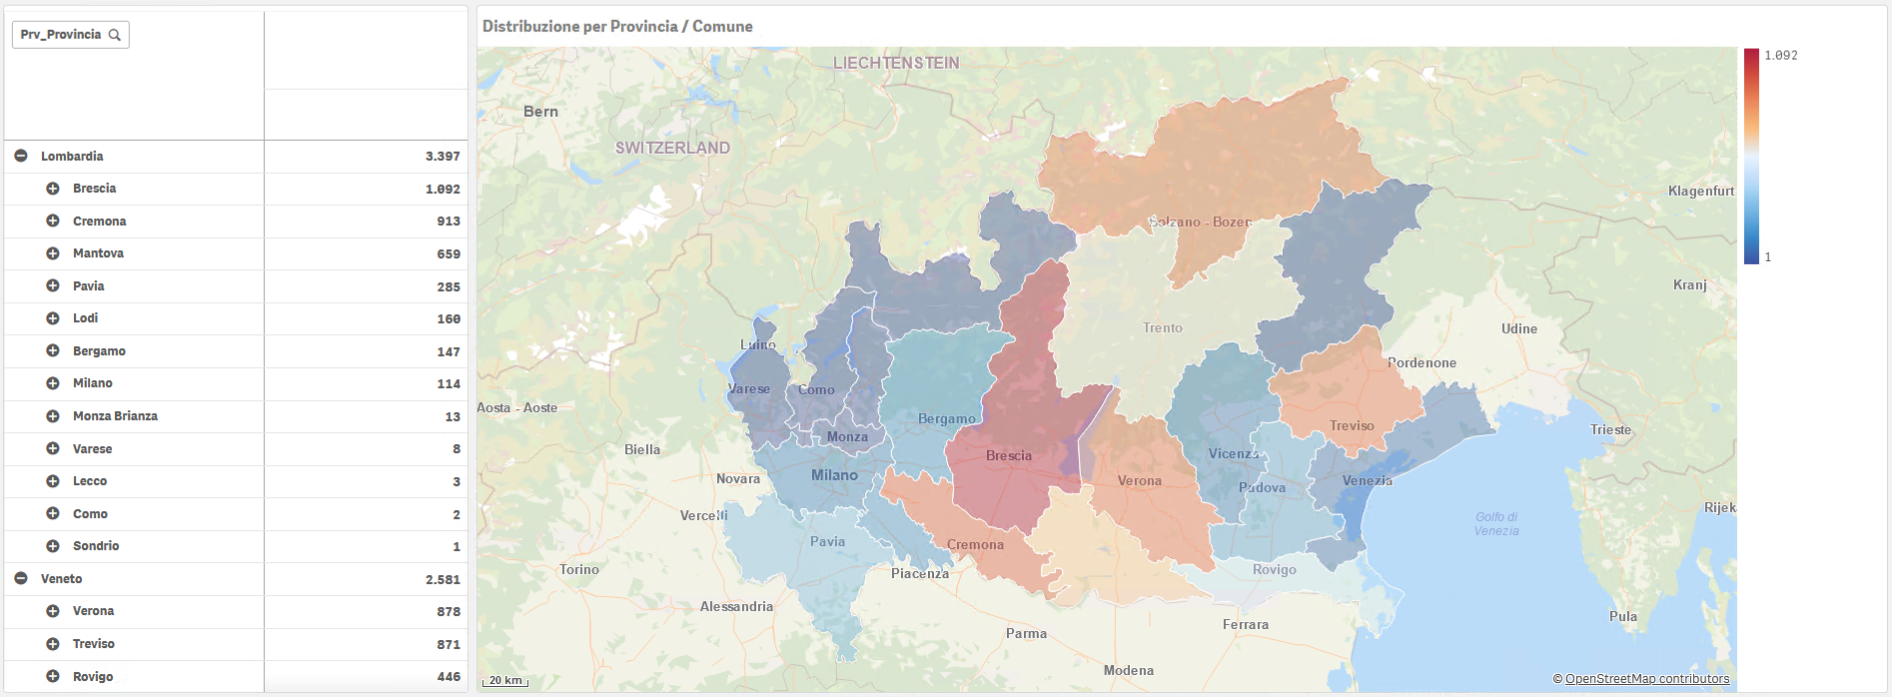
In this case, it was particularly challenging to modeldata within the dashboard in such a way to allow both aggregate and detailed analyses that cross-referenced information that was only present separately in the management system without the possibility of understanding all its aspects.


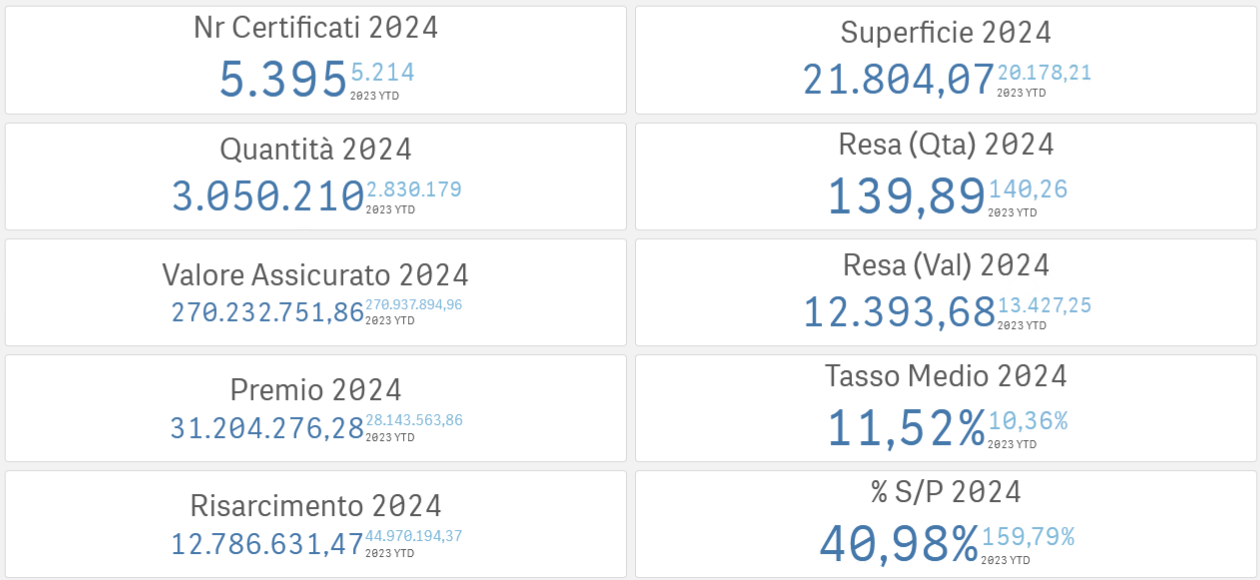
It is now possible to delve into elementary portfolio and claim measures, such as insured value, premium, claims and compensation, as well as compound values, such as the value to be appraised or the ratio between what has been appraised and what has been claimed, up to real KPIs such as the “burning cost”.
Other issues we have addressed with dashboards are cost calculation, which combines the information of expert witness costs, commissions and location, time analysis of expert reports, which is useful for planning the work of the experts, and the re-calculation of compensation, which is useful both to confirm the calculation made within the management system and to be able to monitor the intermediate steps and the main parameters influencing it.
Results
There is now a shared wealth of information available within the company that allows extensive control over most of the processes and situations that arise in everyday work, both at an operational level and at a summary level for management with a single tool.


Do you want to know about our experiences?
Delve into our areas of success and be inspired by our stories of innovation.
